Knowledge Management (KM) is an umbrella term for a variety of techniques for building, leveraging and sustaining the know-how and experience of an organization’s employees. The goal of KM is to make the organization act in an intelligent manner.
Without a good understanding of return on investment or value being added, KM initiatives will be difficult to sustain. Beyond ensuring accountability for KM activities, measurement also provides important information to the KM lead about what is working well, what isn’t, and what adjustments need to be made.
Measurement for an agency-wide KM effort seeks to answer four questions:
Costs: What are we spending on KM support activities? How much time is it consuming?
Outputs: What are we delivering or producing?
Exposure: What is the “market penetration” of the KM support activities? Who are we reaching?
Outcomes:Is the effort having its intended impact? Are we accomplishing our goals?
Approaches to Measurement
Agencies can approach measurement at different levels of detail. Since measurement can be a time-consuming activity, it is best to begin by identifying a few key measures and then add new ones as needed as the KM effort evolves. It is important to strike a balance between the level of effort needed to track KM results and the value of information being produced.
Costs: Costs of KM implementation can be estimated based on the time spent by the KM lead (and others) to plan, facilitate and support KM activities. IT development and content management cost elements may be included as well.
Outputs: The KM lead can maintain a simple activities log to track products and services provided to support KM implementation. Products may include guidance documents or model policies; services may include briefings, trainings, or meeting facilitation.
Exposure/Use: Employee participation in KM activities, and use of knowledge resources can be tracked via manual methods such as meeting sign-in sheets, or automated methods built into systems (e.g., tracking of web page hits or document downloads).
Outcomes: Tracking outcomes is challenging because of the intangible nature of the results being sought – e.g., employee knowledge, organizational effectiveness, and consistency in application of policies and procedures, and resilience. Typical approaches to measuring outcomes involve either surveys or interviews with employees, or studies of specific business process efficiency changes. While time or cost savings should be quantified wherever possible, it is helpful to supplement this with qualitative information that helps people to understand why and how a KM technique was beneficial.
In some cases, employee stories about how they benefited from a KM activity can be translated into estimates of cost savings for the agency. For example, the VDOT KM office facilitated a business process streamlining effort that resulted in an estimated savings of $300,000 annually. Table 4 provides examples of output, exposure/use and outcome metrics for the four categories of KM techniques discussed above.
How to Measure KM Results
The US Navy has developed an excellent “Metrics Guide to Knowledge Management Initiatives” - see reference 27. This guide defines the following steps for measuring and monitoring KM results:
Identify key stakeholders and what they want to know about KM results (e.g., agency leadership, project managers, KM lead).
Select a measurement framework (e.g., balanced scorecard, cause-and-effect diagram, matrix showing expected versus actual results).
Define how the monitoring results will be used by each stakeholder.
Identify measures – tailored to KM initiatives and their implementation phase, including both quantitative and qualitative measures.
Develop data gathering approach (surveys, interviews, automated usage logs, etc.).
Collect and analyze information.
Identify changes to be made based on the results.
The Navy Guide is a useful reference for design of an approach to KM measurement, and includes an appendix with sample metrics.
Table 4. Sample KM Metrics
Agency-Wide KM Elements
KM Outputs
Exposure/Use
Impacts/Outcomes
KM Leadership & Direction
Strategic Planning and Policy Development
KM Education/Training
Knowledge Assessment
Knowledge Mapping/Social Network Analysis
KM Metrics
Completion of KM strategy
Completion of KM Implementation milestones
Number and percent of individuals participating in KM planning & implementation
Awareness of KM strategies and resources
Social Learning & Communities
Communities of Practice (CoPs)
Peer Reviews
After Action Reviews (AARs)
Social Networking and Collaboration Platforms
Expertise Locator/Smart Org Charts
Recognition & Rewards for Collaboration
Number of CoPs coordinated
Number of briefings conducted on AARs
Modifications to recognition programs
Number of posts on collaboration site
Number of participants in Communities
Number of AARs completed
Employee satisfaction
Employee retention
Reported benefits from collaboration (stories)
Knowledge Codification & Dissemination
Lessons Learned Repository
Organizational Narratives/Storytelling
Knowledge Books/Continuity Books
Business Process Documentation/Automation
Contractor Knowledge Transfer
Content Management/Portals/Wikis
Common Vocabulary/Content Classification
Personalization/Role-Based Subscriptions
Number of processes documented
Number of Lessons Learned added to Repository
Number of videos produced
Policy in place for contractor knowledge transfer
Number of lessons downloaded
Number of videos watched
Average number of monthly updates to Wiki page
Number of active subscriptions
Employee awareness and evaluation of available resources
Savings from process streamlining and automation (study)
Reported benefits from use of available resources (stories)
Process consistency (study)
Succession & Talent Management
Talent Tracking
Desk-Side Reviews
Mentoring, Shadowing and Job Rotation
Phased Retirements
Leadership Training
Number and percent of position descriptions updated with knowledge, skills & abilities requirements
Number of training sessions for mentors
Number and percent of employees completing leadership training
Number and percent of employees participating in job rotation or mentoring
Bench strength (number of possible successors for given position)
Reported benefits from job rotation and mentoring (stories)
KM Outcomes
Before outcome measures can be defined, it is helpful to define expectations for each KM activity or initiative. Key types of outcomes for KM implementation include: adaptability/agility, creativity, institutional memory building, organizational internal effectiveness, and organizational external effectiveness. Once expectations are set, then specific surveys, interviews, or studies can be designed to assess results. The following examples provide a starting point for thinking about expected results from selected KM activities.
Expertise Locator System:
Reduced training time or learning curve.
Improved decision making due to knowing the right person to address the questions from the expertise locator system.
Reduction of re-work.
Improved service to external partners or stakeholders.
After-Action Reviews (AARs):
Application of existing know-how in future similar activities.
Reduced training time or learning curve.
Improve organizational decision-making or quality of products resulting from application of best practices/lessons learned.
Time reduction for document preparation process due to learning from others via the AAR.
Improved agency image (as measured by customer satisfaction surveys) due to learning from previous successes and failures and reacting expeditiously.
Lessons Learned (LL) Repository:
Improved performance and decision making through use of the LL resources.
Reduction in cycle time through use of the LL resources.
Decreased learning curve for new employees.
Increased consistency in performing job duties across similar roles in the agency.
Collaboration Platforms:
Decreased average problem-solving time.
Reduced rework through learning from others.
Improved employee retention due to higher satisfaction associated with collaborative environment.
Reduced tendency for employees to “reinvent the wheel” or repeat past mistakes due to improved institutional memory.
Accelerated transfer and use of existing know-how for increased learning.
Decreased learning curve for new employees.
Communities of Practice:
Increased collaboration due to stronger sense of belonging and trust.
Innovations and creativity increased through knowledge sharing.
Improved decision-making and work quality resulting from collaborative efforts.
Increased organizational resilience due to improved collaboration and networks.
Table 5 and Figure 6 illustrate how the Virginia DOT has characterized outcomes from their KM initiatives.
Table 5. Sample Outcomes from the Virginia DOT KM Initiatives
Initiative
Outcome
Lessons Learned Database
Increased knowledge base on successful construction practices; strong level of support and utilization from construction managers and inspectors; national recognition for agency.
After Action Review: Winter Maintenance
Led to statewide implementation of anti-icing program based on techniques developed by frontline managers; findings will be incorporated into staff training programs.
Standard Operating Procedure Development: Emergency Response Task Force
Definition and common understanding of VDOT’s response to different incident types: crashes, terrorist attacks, HAZMAT spills, and weather-related events.
Facilitation: Interagency Coordination On Incident Management
Improved working relationships, leading to shortened incidence clearance times.
Organizational Network Analysis: for successful construction project
Evaluation of how team member communication network contributed to project delivery efficiency and effectiveness – lessons can be applied to future construction projects.
Process Mapping: Environmental review process
Annual cost savings of $300,000 from process streamlining; improved understanding of process and its intersection with other processes; model for other groups.
CoP Support: Construction
Statewide vertical and horizontal integration of construction expertise used to inform the state strategic plan.
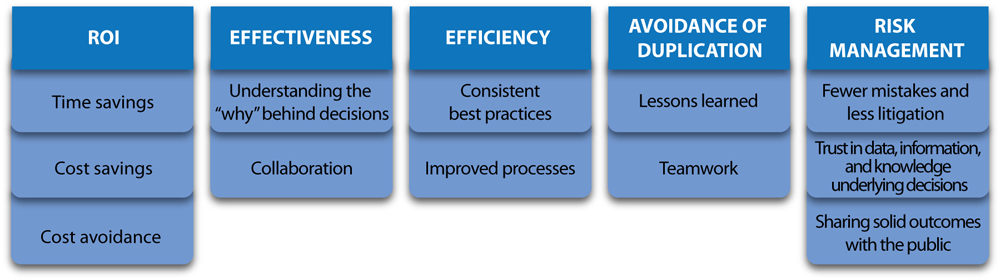
Figure 6. Virginia DOT Measurement Framework for KM Outcomes
A balanced approach to monitoring KM value and effectiveness should include tracking of costs, outputs, exposure or use, and outcomes.
Documenting return on investment is important, but it is also valuable to capture success stories and qualitative descriptions of outcomes.
In order to mitigate risks, the KM outcome metrics should map back to the agency’s strategy, goals, and objectives.
KM at Chevron
“Of the initiatives we’ve undertaken at Chevron during the 1990s, few have been as important or as rewarding as our efforts to build a learning organization by sharing knowledge. In fact, I believe this priority was one of the keys to reducing our operating costs by more than $2 billion per year—from about $9.4 billion to $7.4 billion—over the last seven years”