WVDOT
Integration of asset & roadway characteristics data, tracking of work and route maintenance, crash and asset data analysis, and enterprise LRS data integration.
Integration of asset & roadway characteristics data, tracking of work and route maintenance, crash and asset data analysis, and enterprise LRS data integration.
Using GIS to integrate multiple spatially referenced datasets, resource allocation scenario analysis, and agency/public stakeholder communication.
Using GIS to integrate pavement, traffic, weather, and winter maintenance data for analysis and effective communication and use of results agency wide.
In 2012, the State of West Virginia began the wvOASIS project. wvOASIS reaches across many state agencies to implement enterprise resource planning (ERP) technology. The goal of the project is to "gain operational efficiencies and seamless integration across administrative business functions by fundamentally transforming how the State manages its financial, human resources, procurement and other business processes". For WVDOT, the ERP project focuses on implementing several modules of a commercial asset management suite including maintenance, fleet, traffic and safety.
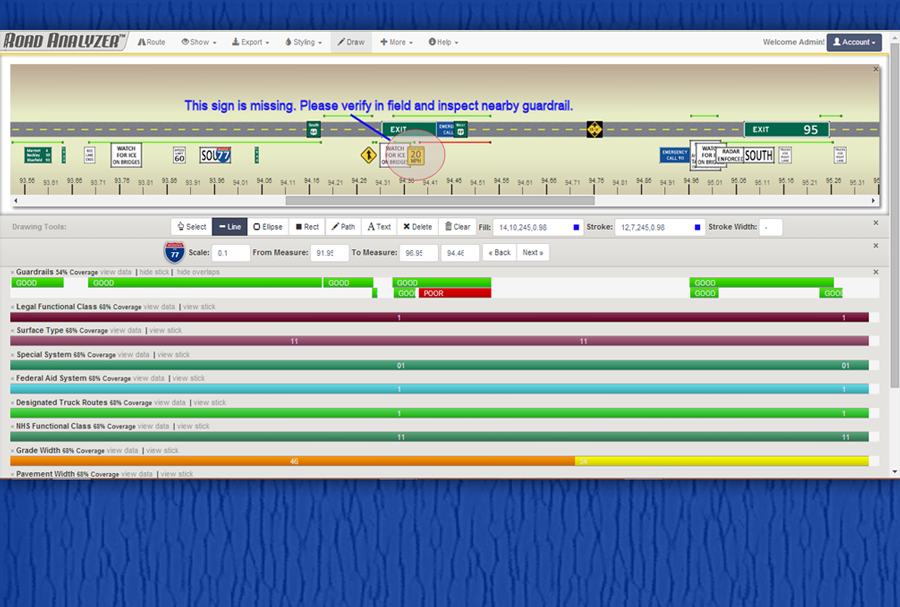
While the wvOASIS project has been underway, WVDOT has made big strides on the geospatial front. The agency has developed a number of geospatial applications that allow for viewing, mining, reporting, and mapping asset and event data. These geospatial applications include a new Linear Referencing System (LRS), a straight line diagramming (SLD) solution with integrated mapping and video log components and a Highway Performance Monitoring System (HPMS) Console. WVDOT is now implementing an interface between the enterprise LRS and asset management modules.
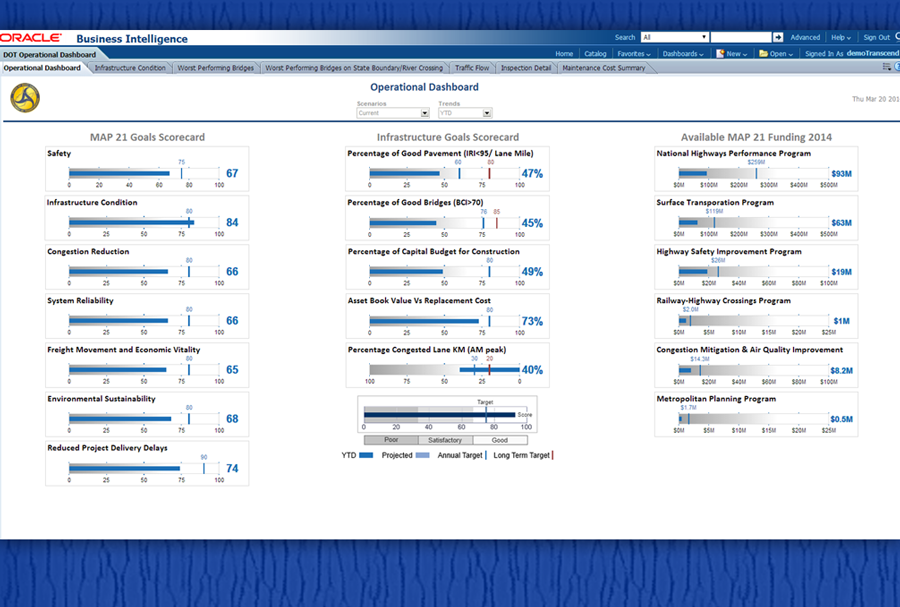
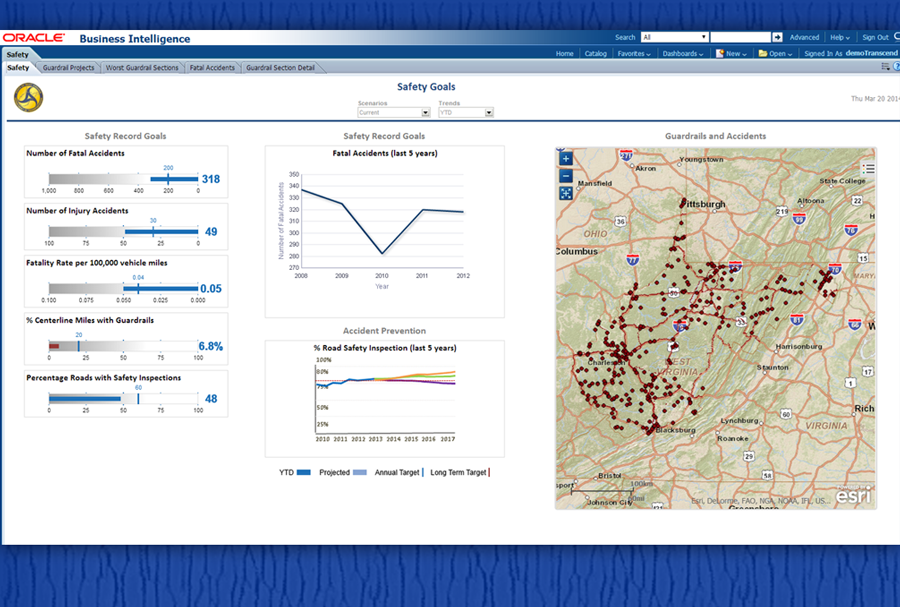
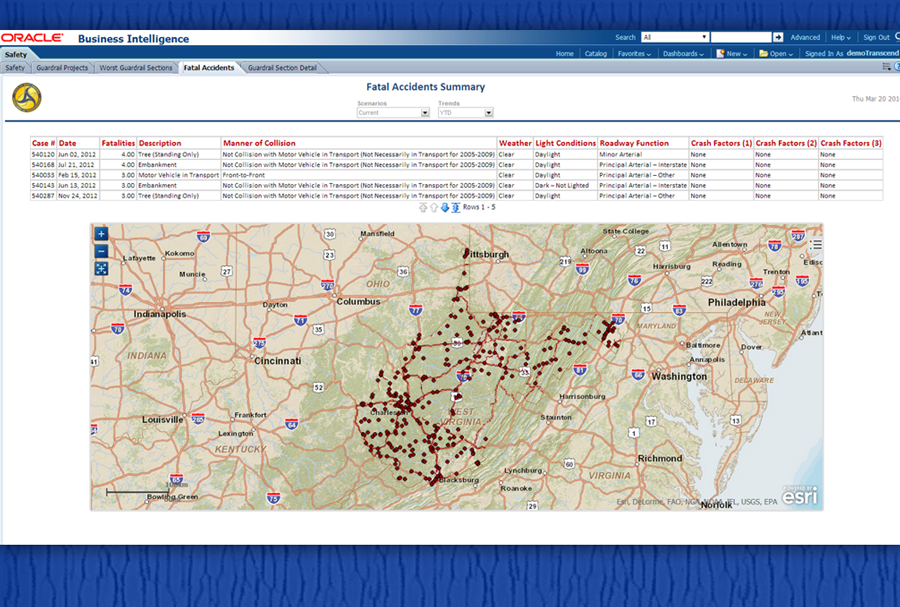
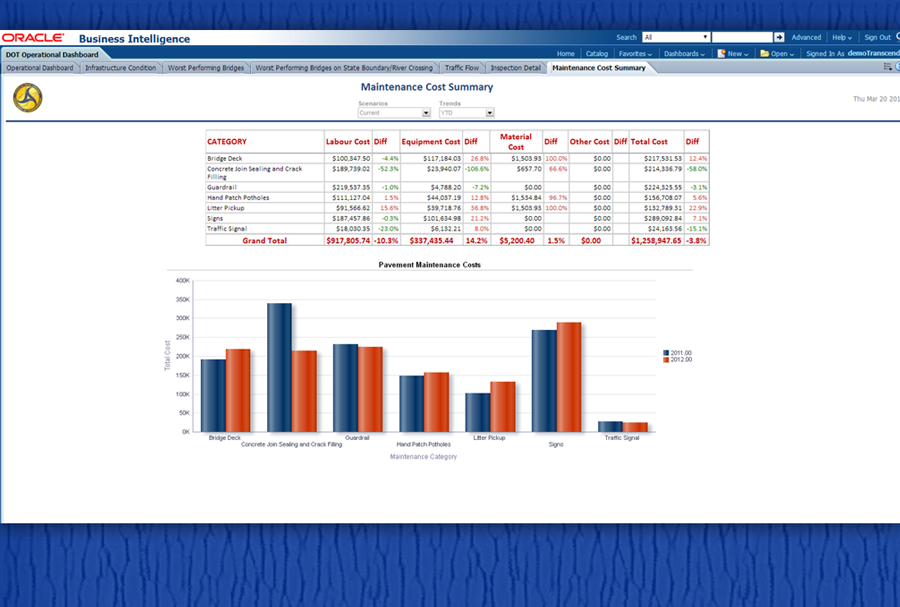
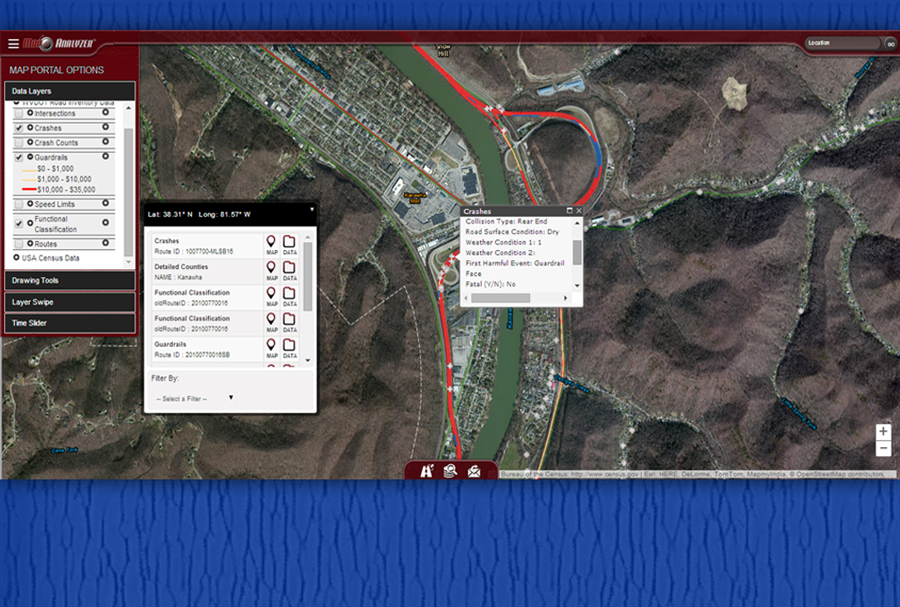
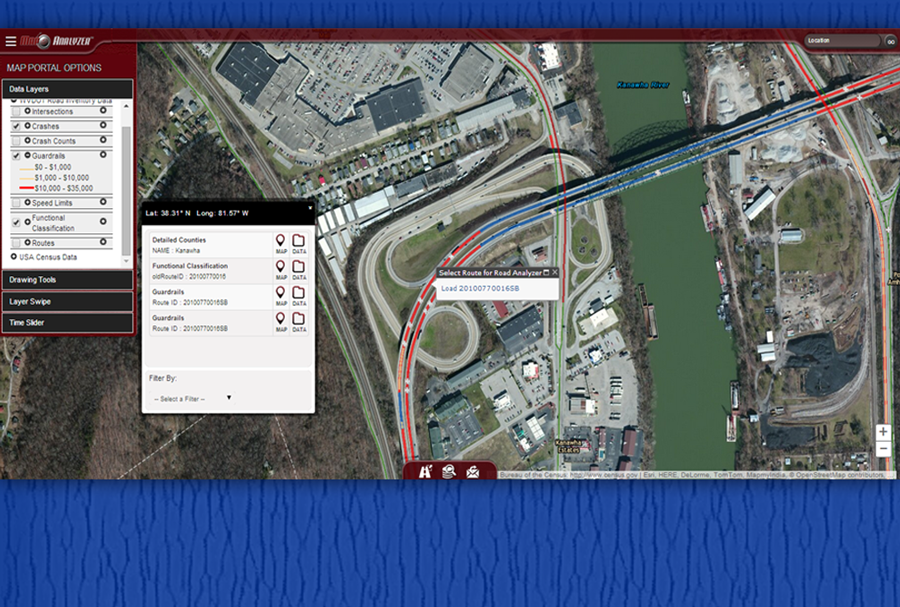
The WVDOT pilot highlights the effectiveness of performance measure dashboards and then focuses on the integration of maintenance and crash data from asset management systems, cost data from wvOASIS, roadway characteristics data from WVDOT's Geospatial Transportation Information (GTI) Unit, and Google's Street View data. The integration of these data layers are used to communicate the performance of assets and the WV road network, and to analyze crash and asset data to assist with recognizing trends and mitigating risks by addressing areas of concern.
IThe pilot also illustrates the ability to collect data in the field using tablets and to assign work to maintenance crews in an efficient manner. Finally, it describes the integration of enterprise LRS data maintained outside of TAMS with the location components of assets managed within TAMS.
Performance Measure Dashboards allow DOTs to access information about how a DOT is performing. Many DOTs are establishing measures based on recommendations outlined in MAP-21. This portion of the pilot demonstrates the ability to review trends and to drill down to additional information about key performance indicators.
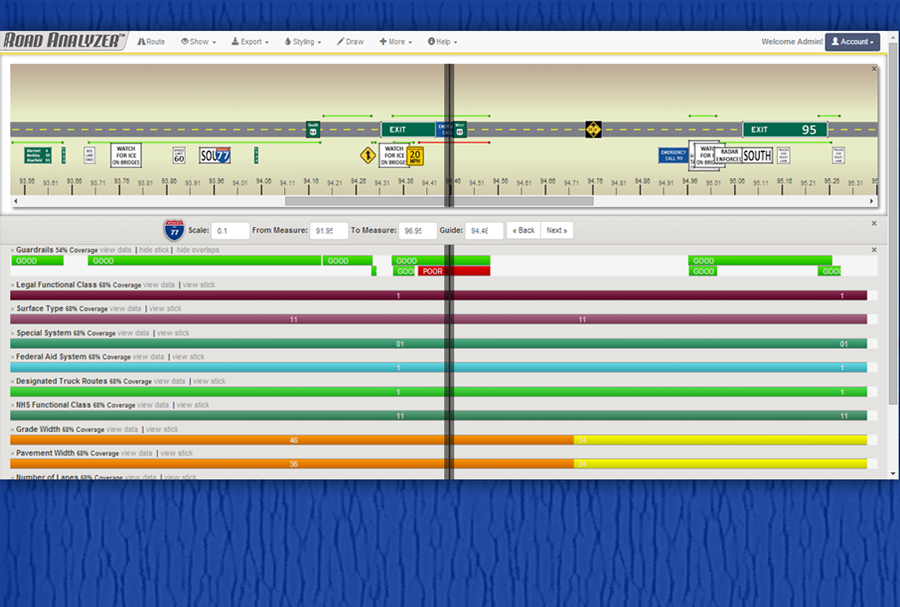
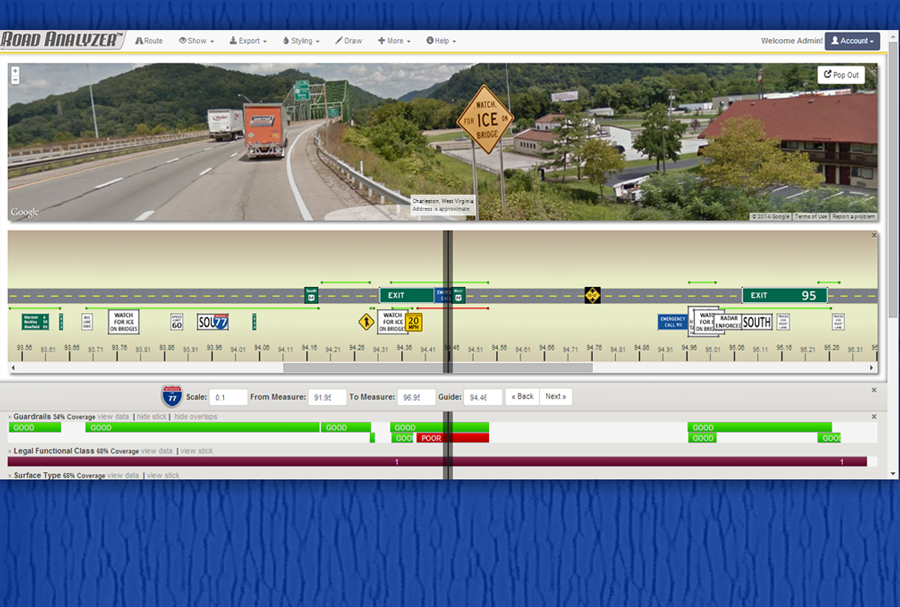
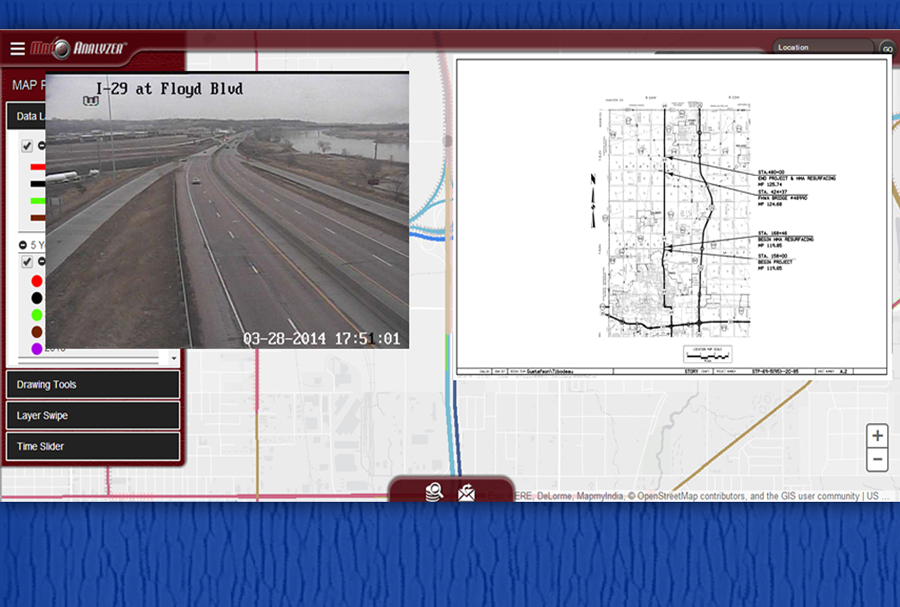
Geospatial portals and straight line diagramming applications are used to view, analyze and report on the many layers of information maintained by DOTs. This portion of the pilot demonstrates WVDOT's planned geospatial portal, and its existing SLD and integrated video log solutions.
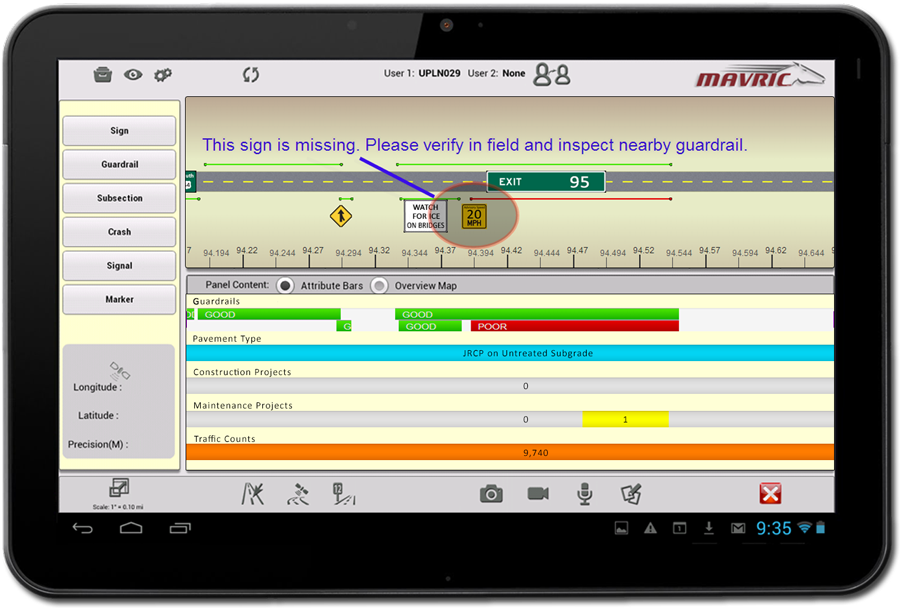
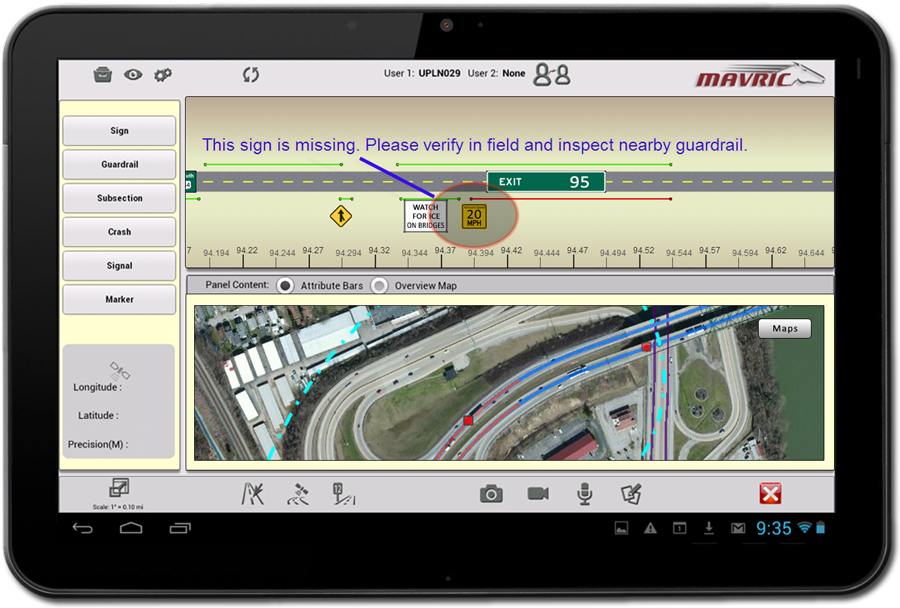
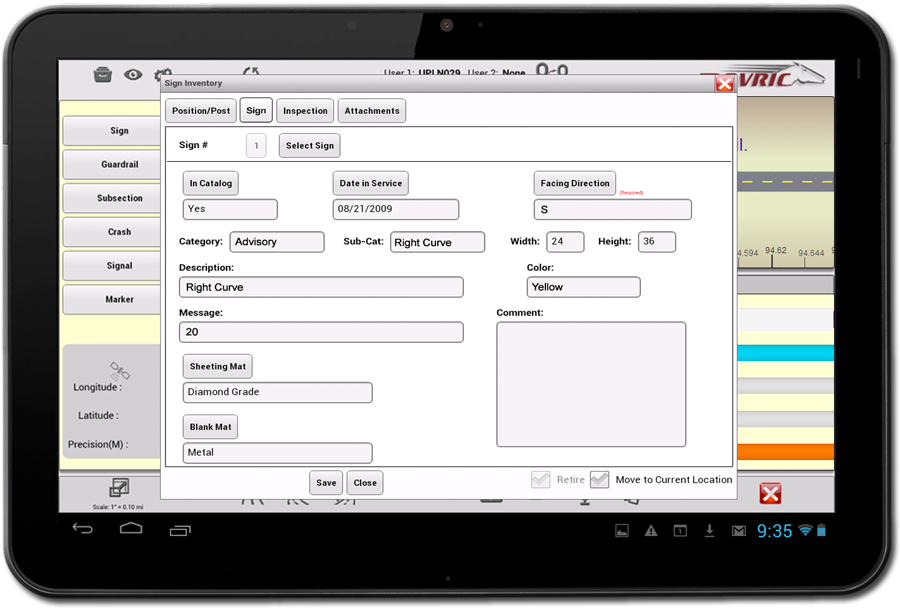
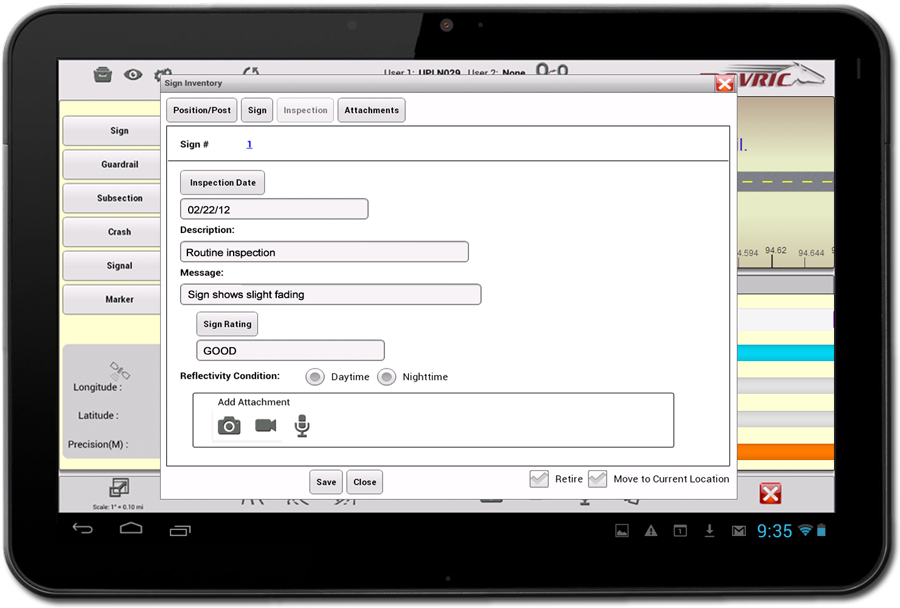
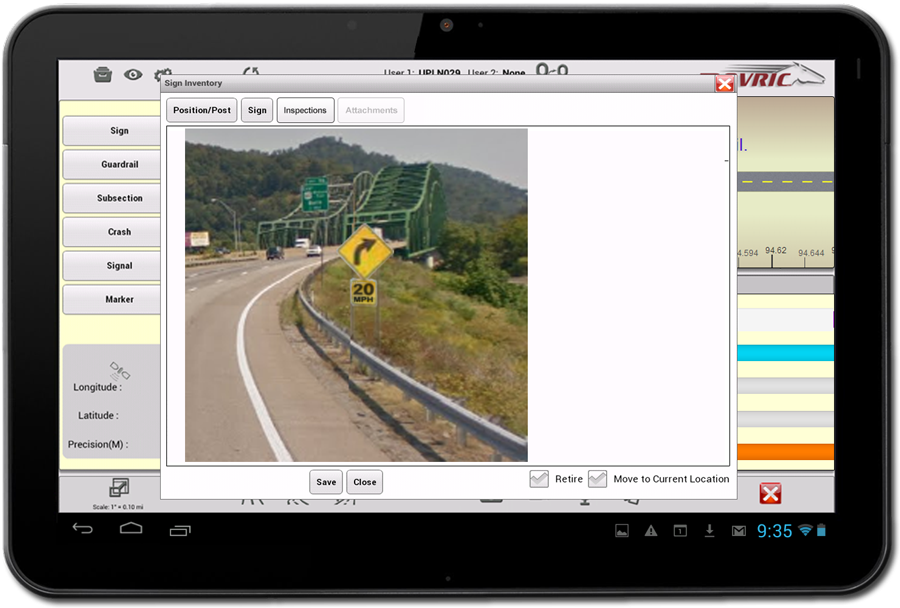
West Virginia DOT is moving towards using tablets for field data collection. This portion of the pilot demonstrates field data collection of asset inventories and inspections.
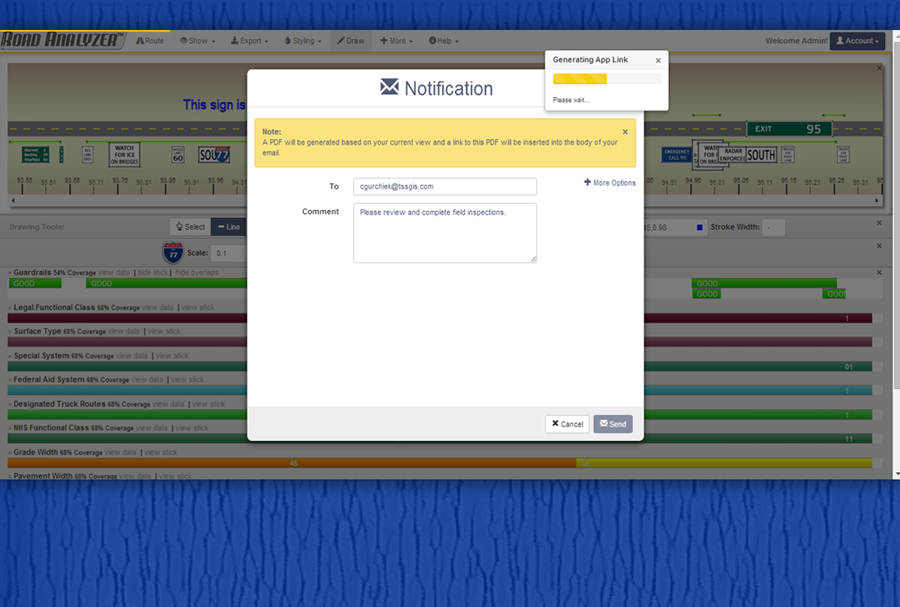
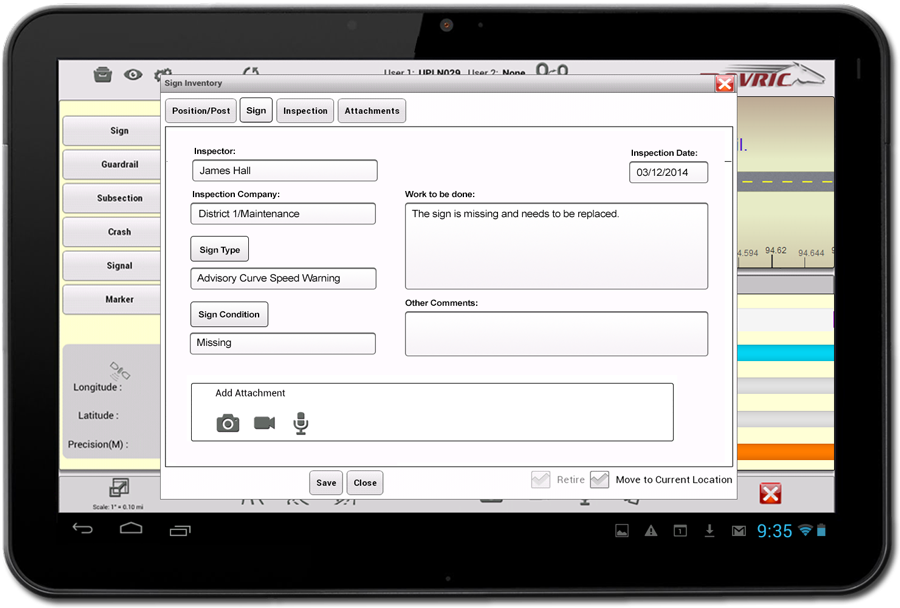
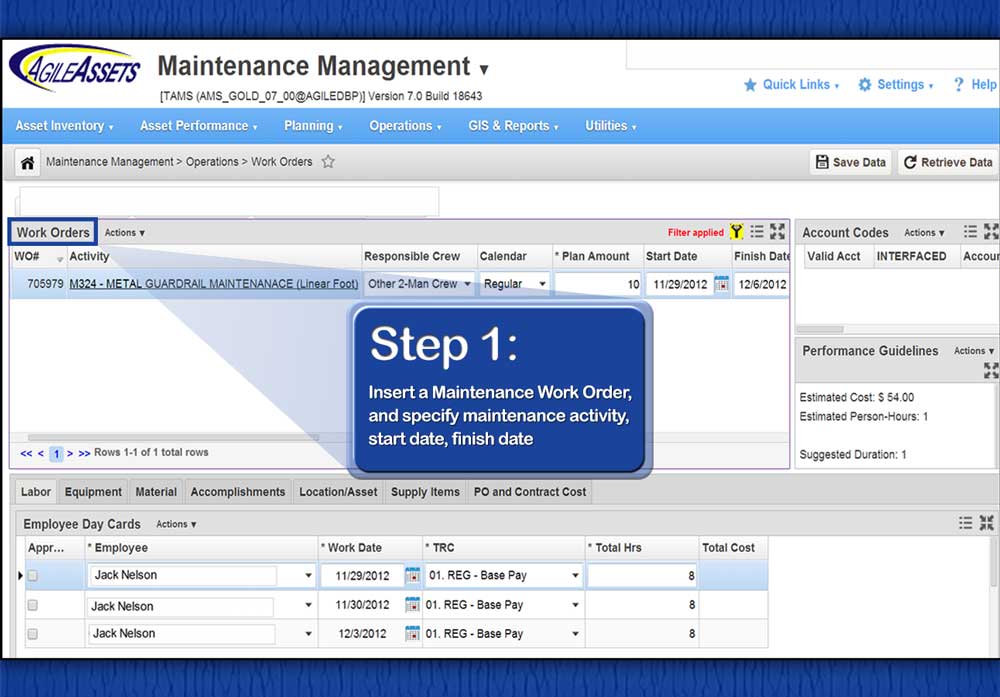
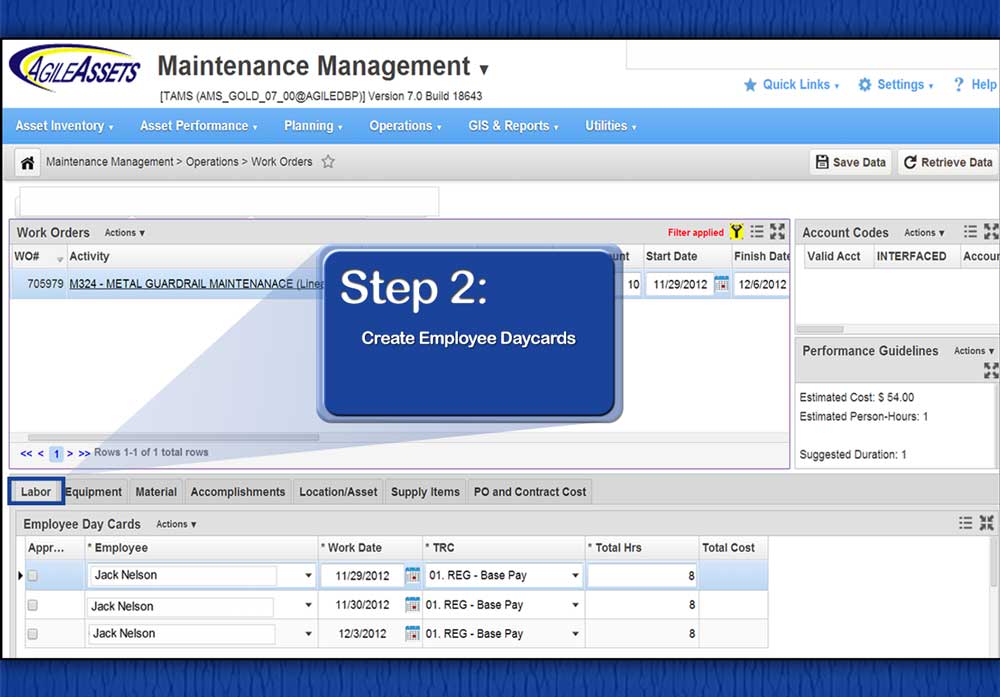
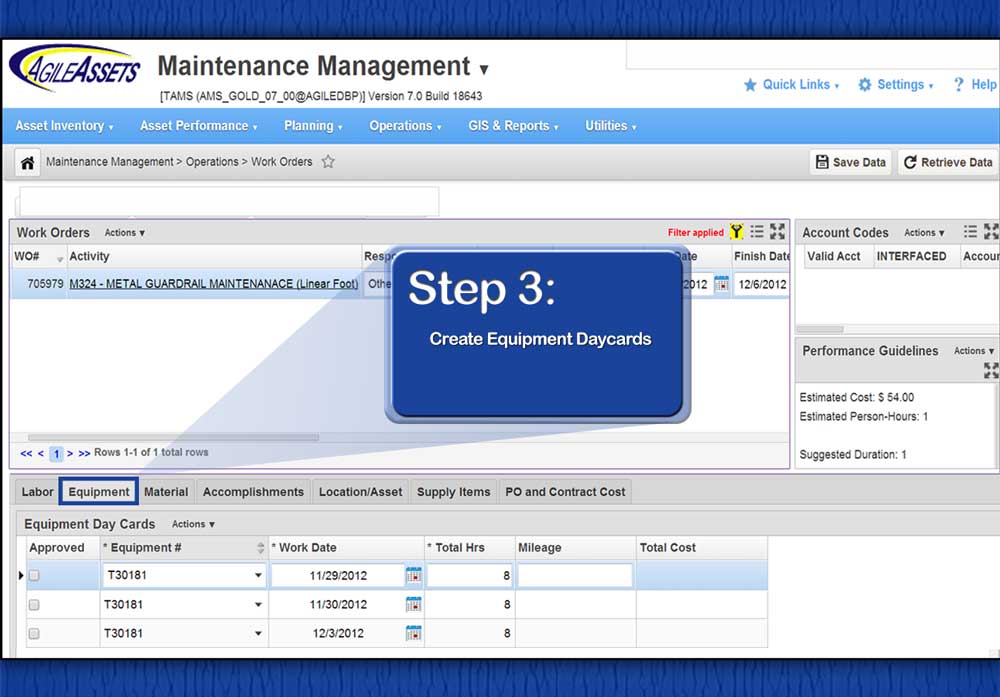
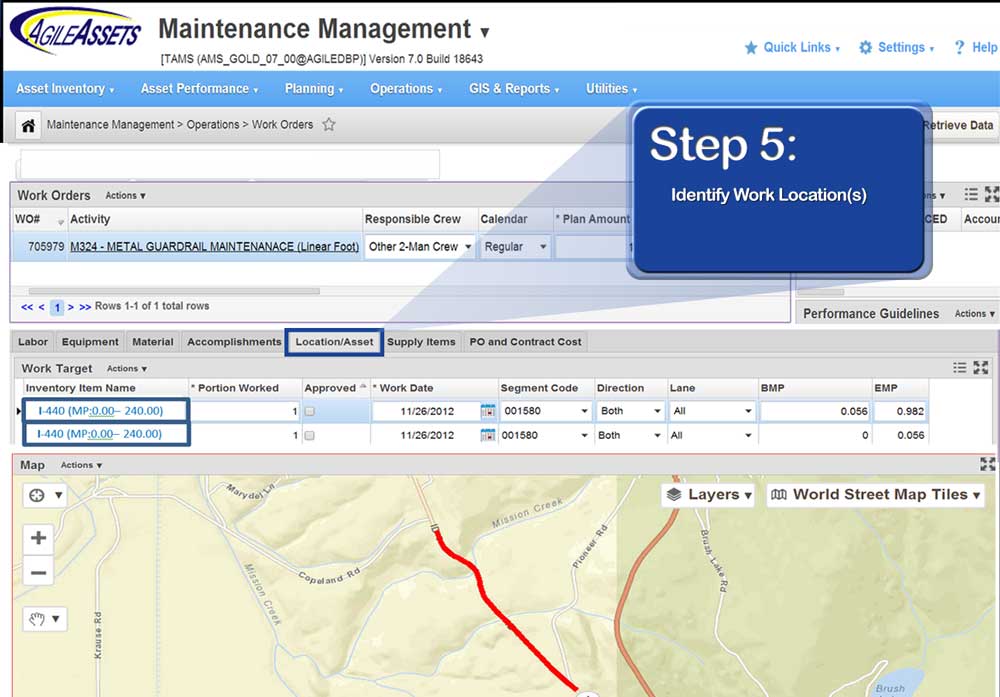
As part of the wvOASIS project, WVDOT is implementing transportation asset management modules for maintenance, fleet, traffic and safety. A core capability of the TAMS is the ability to assign and track work. This portion of the pilot demonstrates assigning work to address conditions recorded in the field.
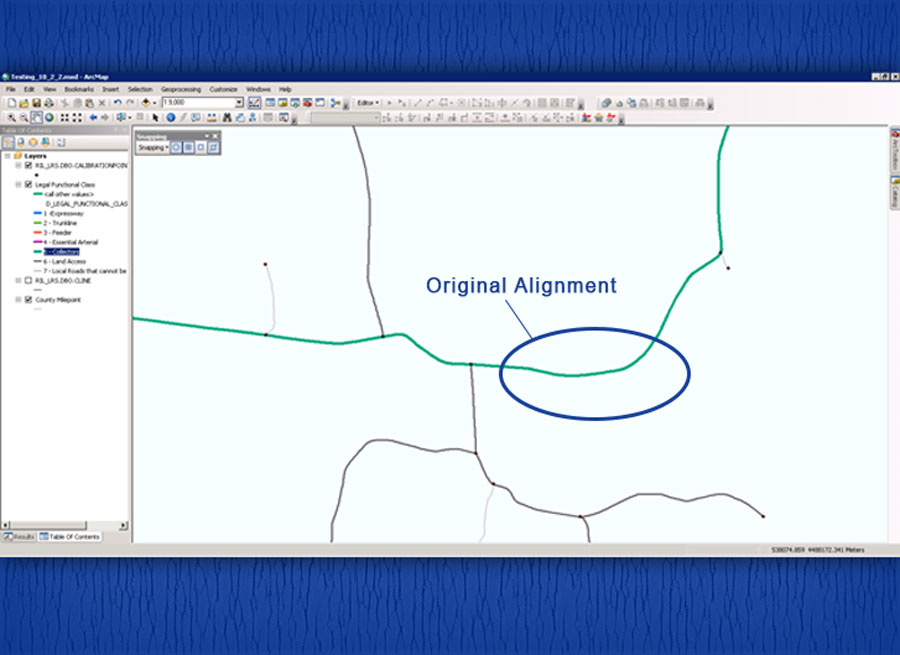
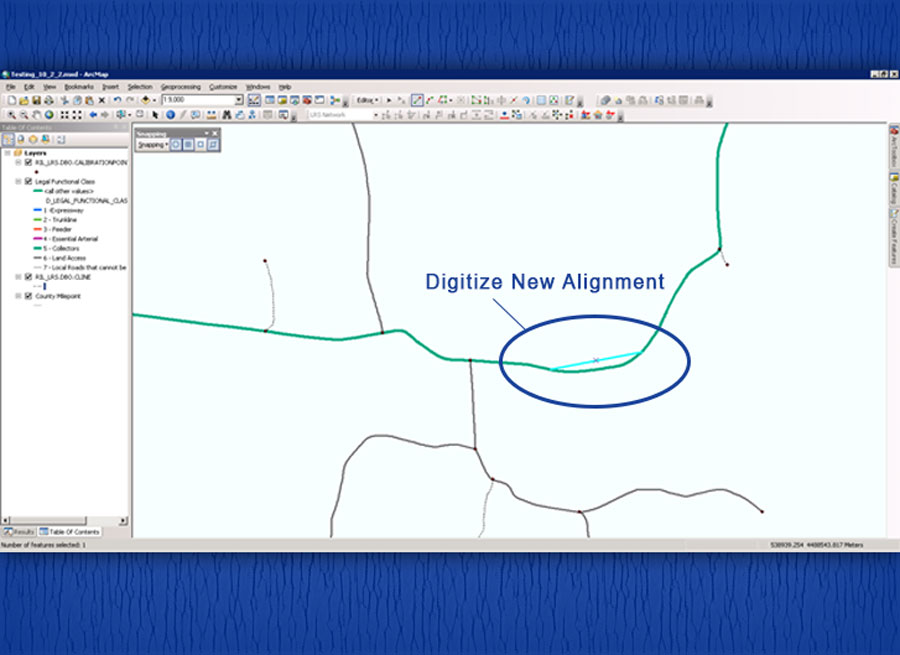
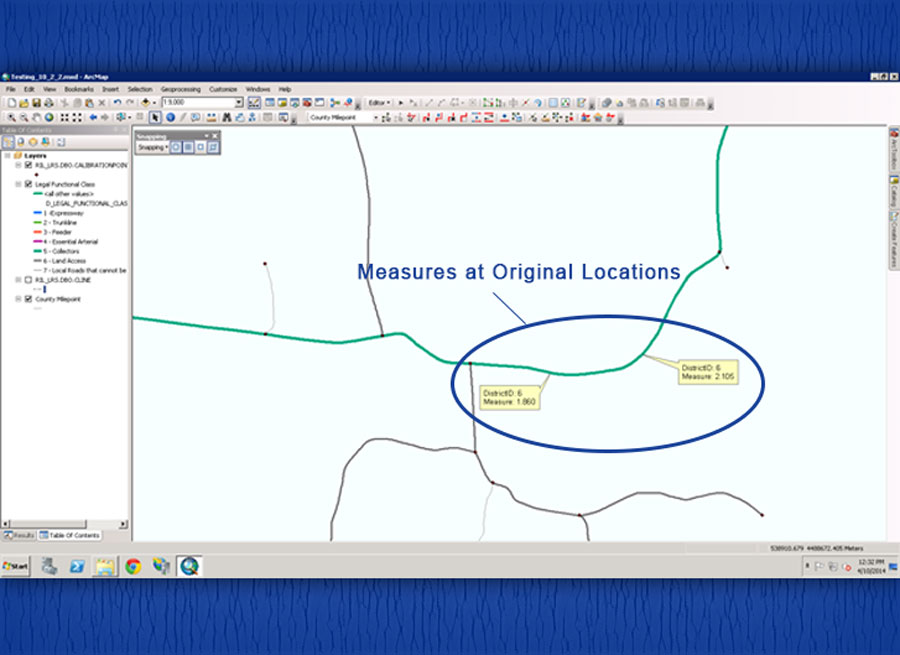
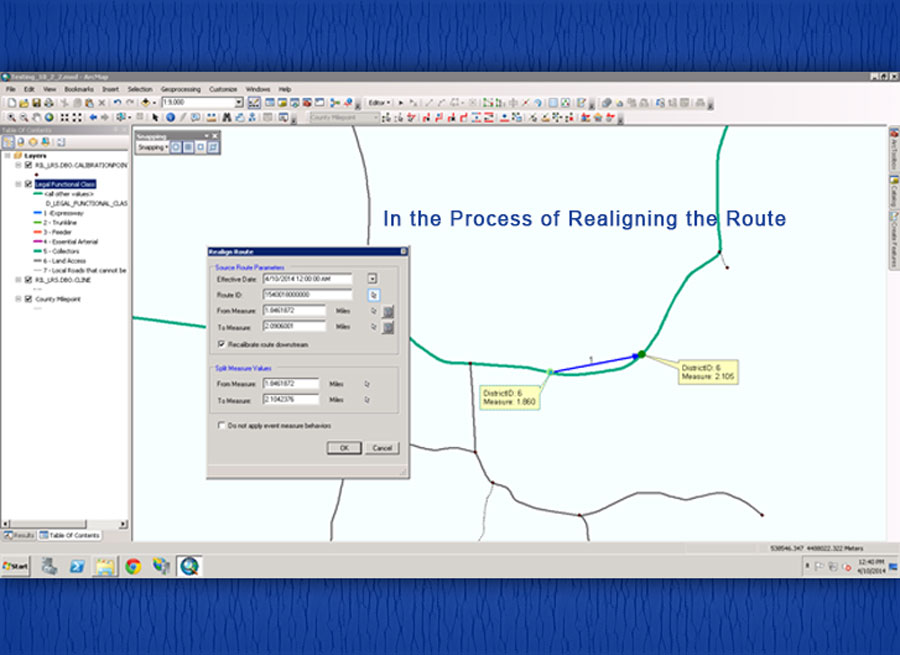
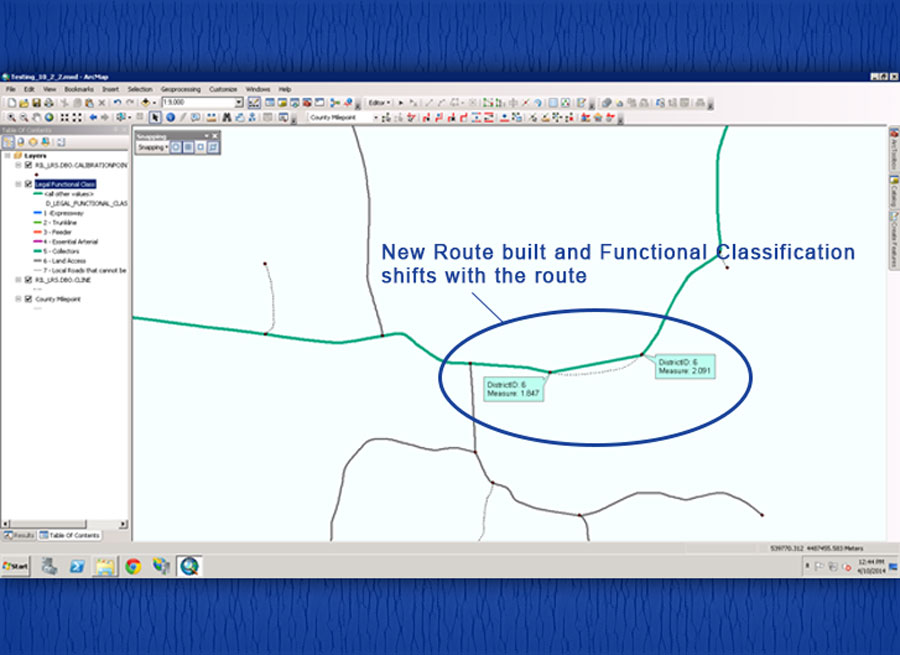
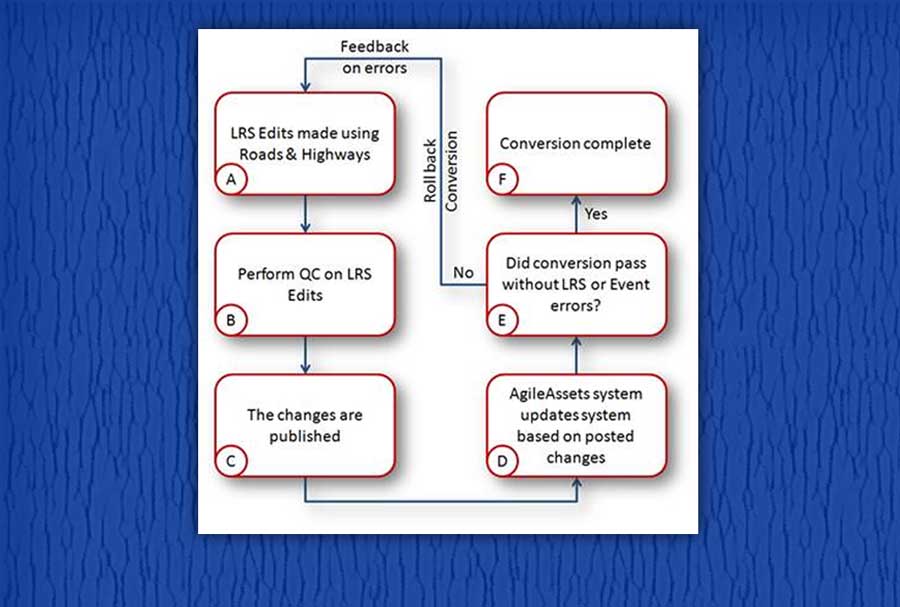
At WVDOT, as with most DOTs, different business units are responsible for the individual TAM modules and these units are generally also different from the units responsible for LRS and geospatial application development. Although separate, information needs to be shared across these business units which means that the network and LRS information must be kept in sync with the TAM modules. This portion of the pilot describes the approach being taken by WVDOT to keep its LRS network up to date and to build interfaces between the LRS and the TAMS modules.
Before the MAP-21 legislation was signed into law, the Colorado Department of Transportation (CDOT) had embraced asset management as an important business practice for maintaining its assets in a state of good repair over the long-term with the least investment of resources. For example, since 2011 CDOT's asset managers have been working with the Multi-Asset Management System (MAMS, now renamed the Asset Investment Management System or AIMS) to develop budget scenarios and explore the relationship between funding and performance. Now that MAP-21 is in place, CDOT is establishing risk-based asset management as the official approach for strategic preservation of the DOT's assets and related investment decisions for those assets.
The Transportation Commission of Colorado approved the Risk-Based Asset Management Plan (RB AMP) in January 2014, and it provides a comprehensive plan for implementing and sustaining Transportation Asset Management (TAM) at CDOT. The plan is intended for CDOT's asset managers and stakeholders, including the citizens of Colorado. It provides a summary of the assets maintained by CDOT and an assessment of financial and risk considerations relating to these assets.
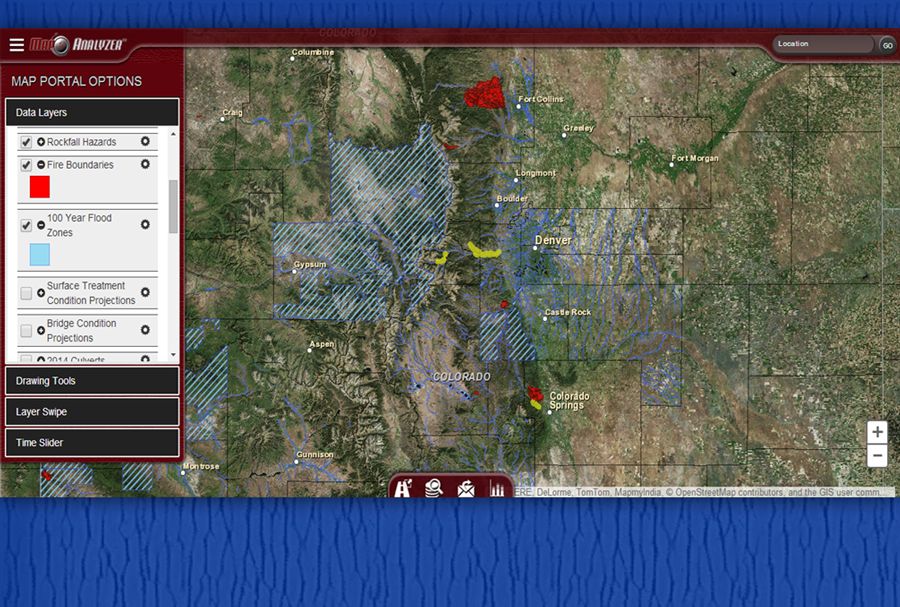
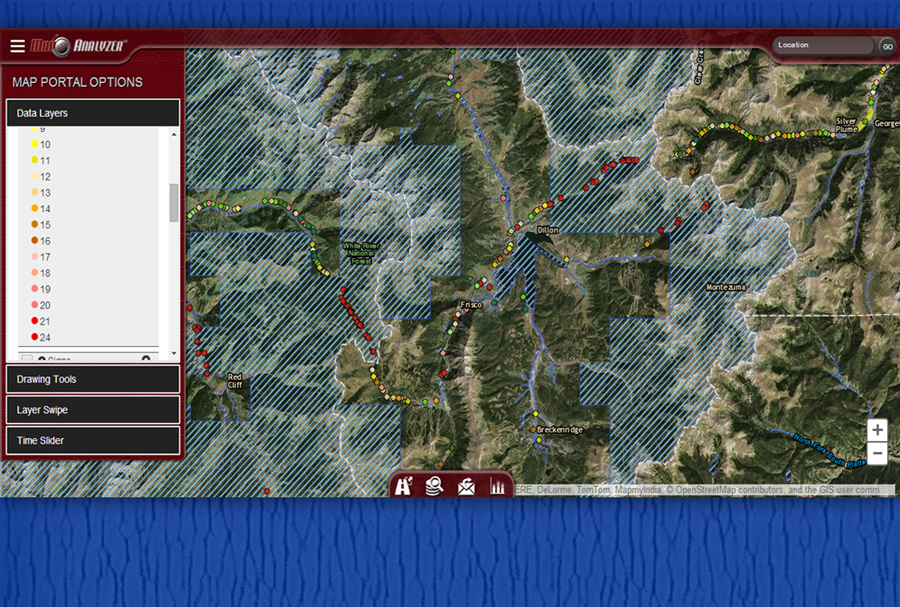
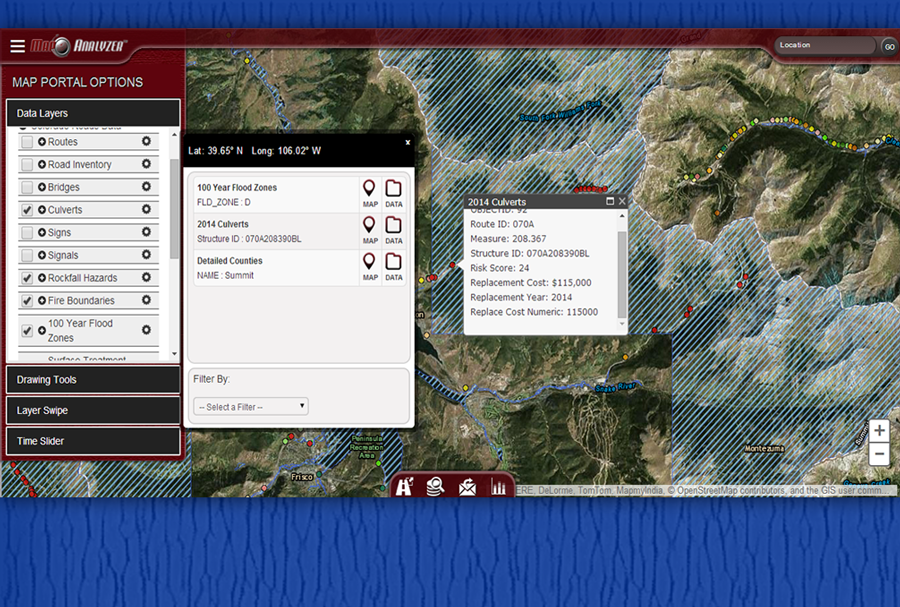
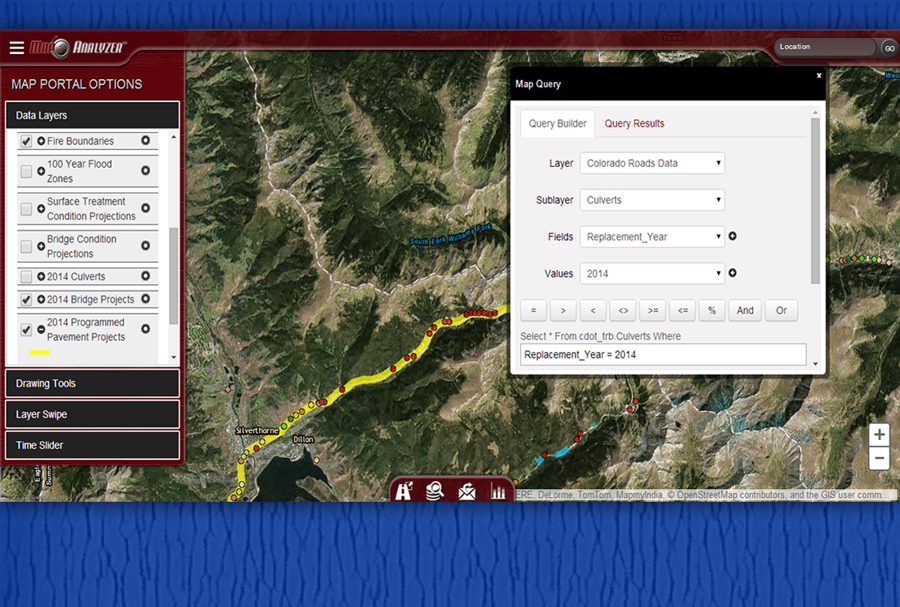
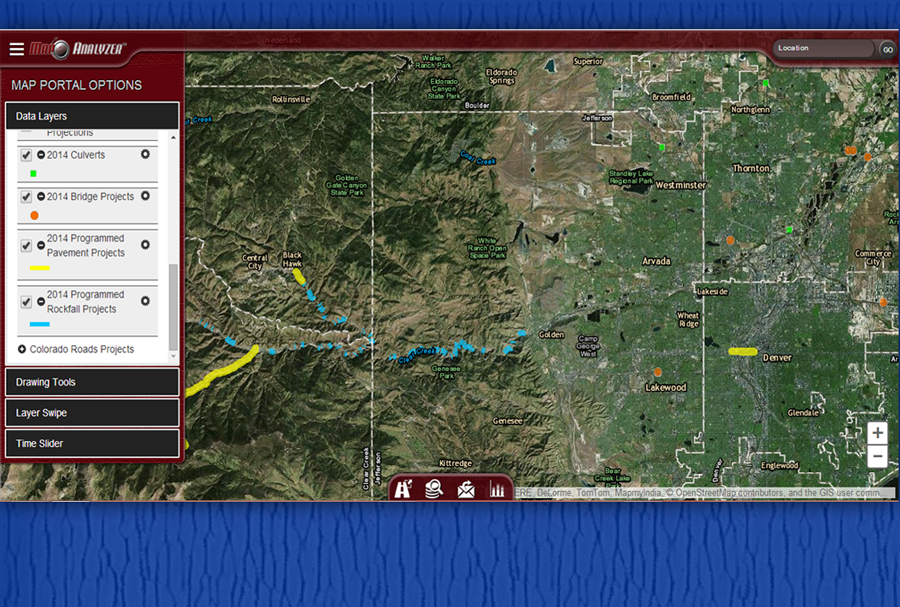
The CDOT pilot illustrates the use of GIS in conjunction with AIMS to assist in CDOT's program development process, as well as the use of new risk-based approaches to project prioritization. It illustrates integration of multiple spatially referenced data sets; analysis of the performance implications of different resource allocation scenarios and project selections, and communication of the selected projects to agency stakeholders and the public.
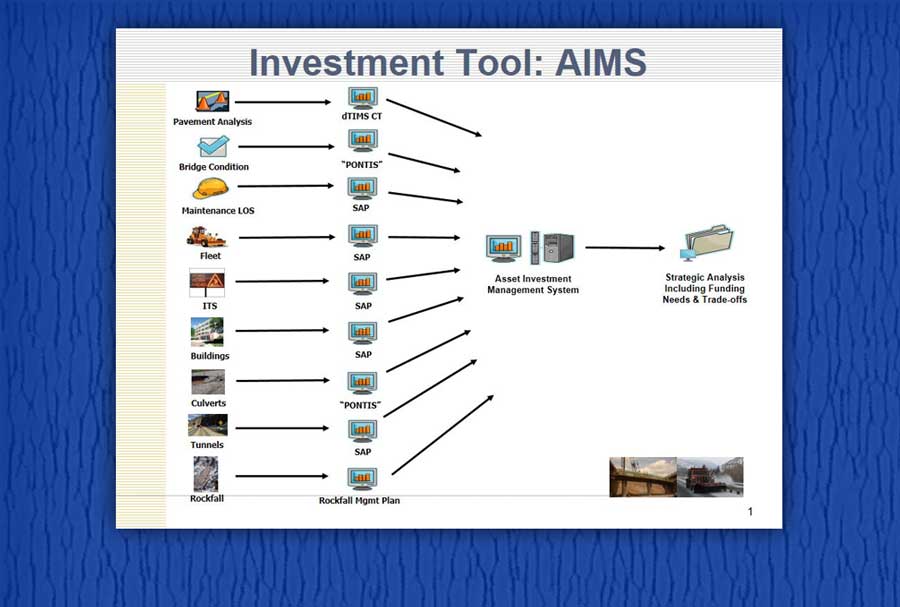
CDOT uses AIMS, which is based on a commercial asset management application and supports life cycle forecasting of nine different asset categories including pavement, bridges, maintenance, fleet, ITS devices, buildings, tunnels, culverts, and rock fall sites. AIMS integrates this information from a variety of sources as shown in the AIMS Data Source Diagram. AIMS uses deterioration models and decision rules for each asset to enable analysis of current and future needs.
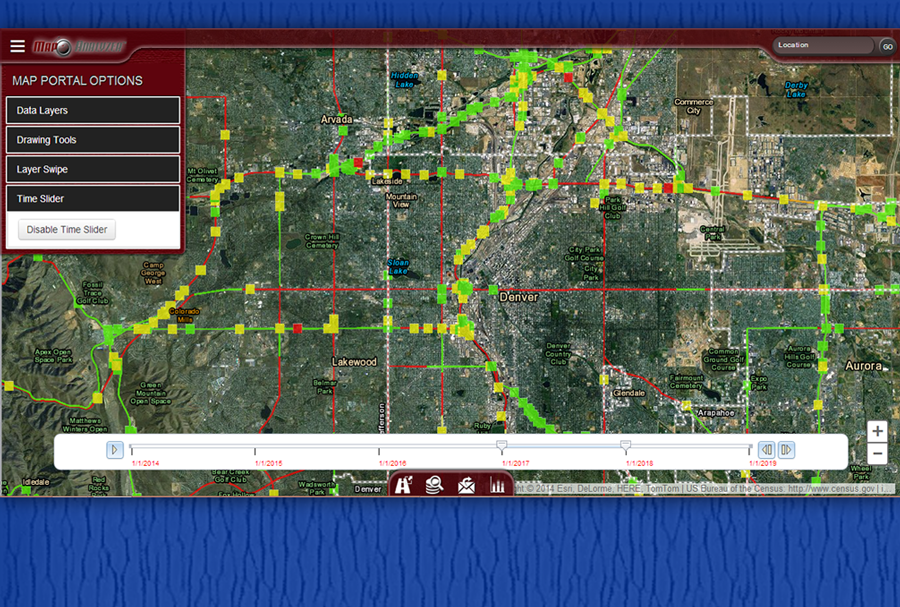
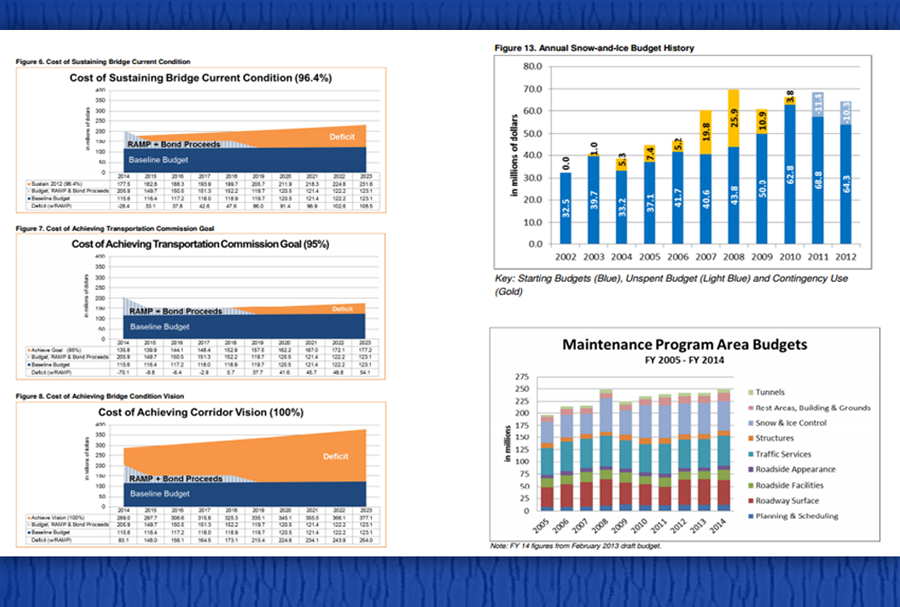
To make effective decisions, DOTs need to view condition data as it changes through time. This portion of the pilot illustrates the ability to view the temporal aspects of bridge and pavement condition data.
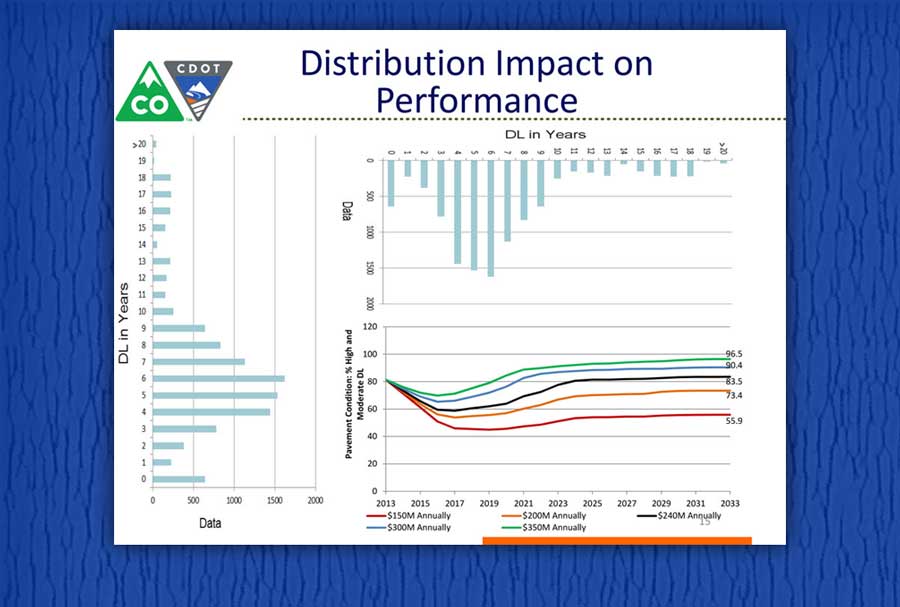
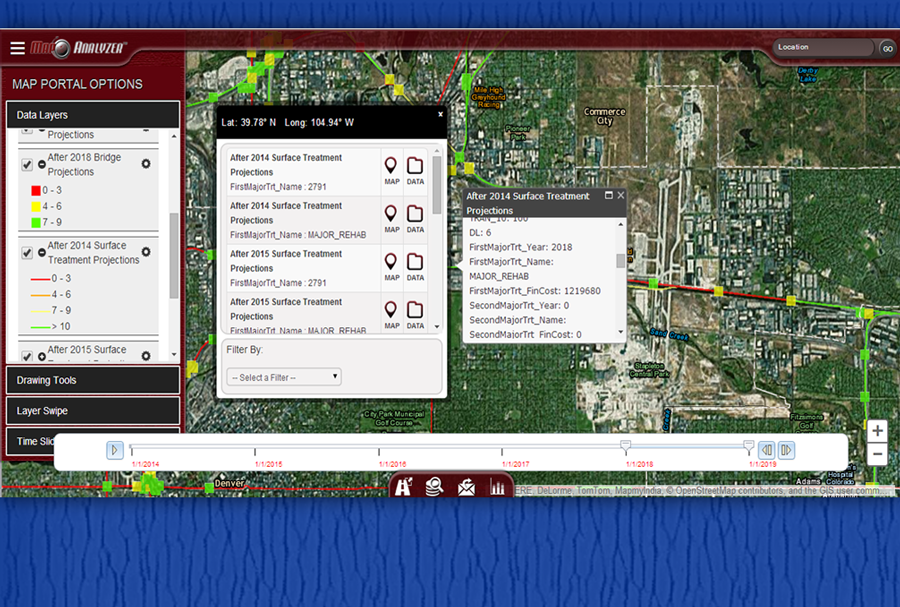
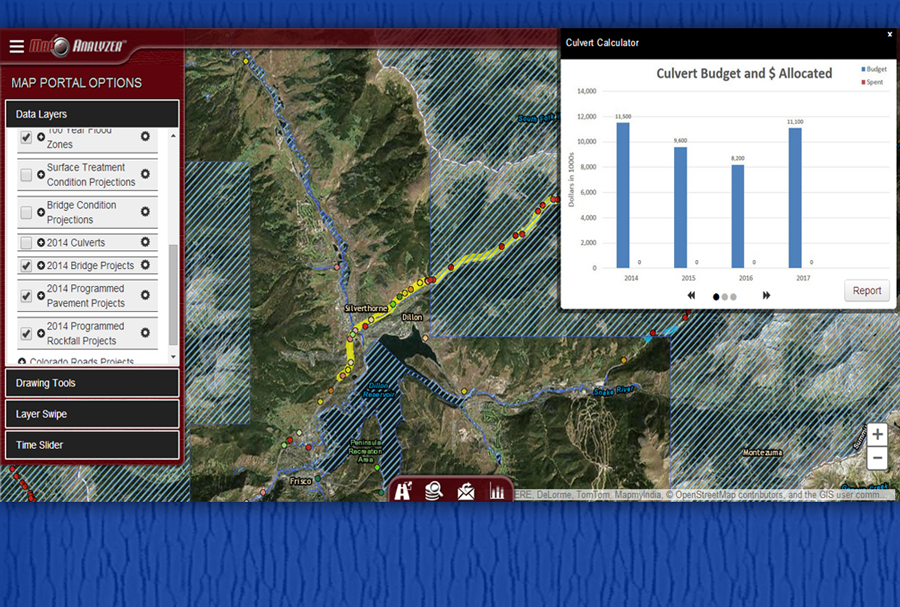
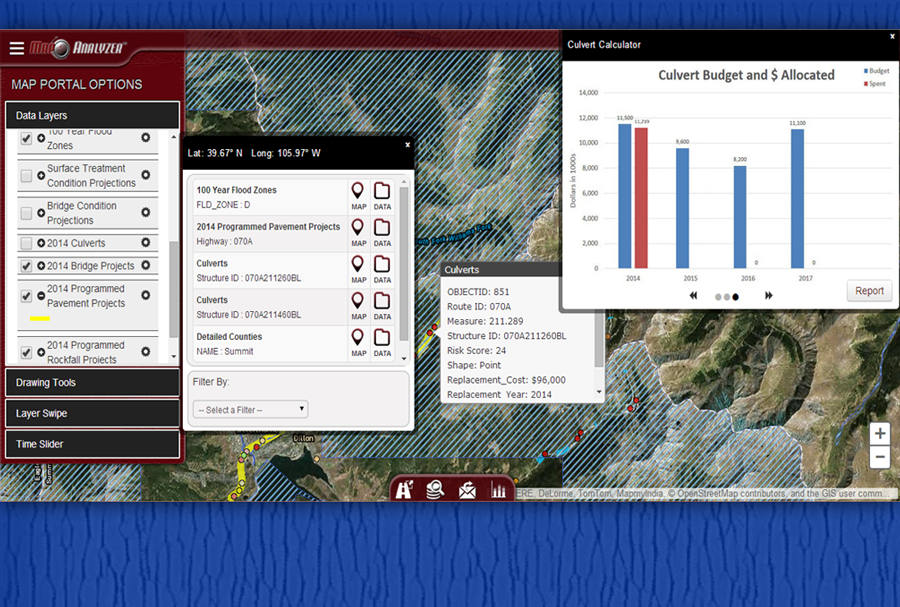
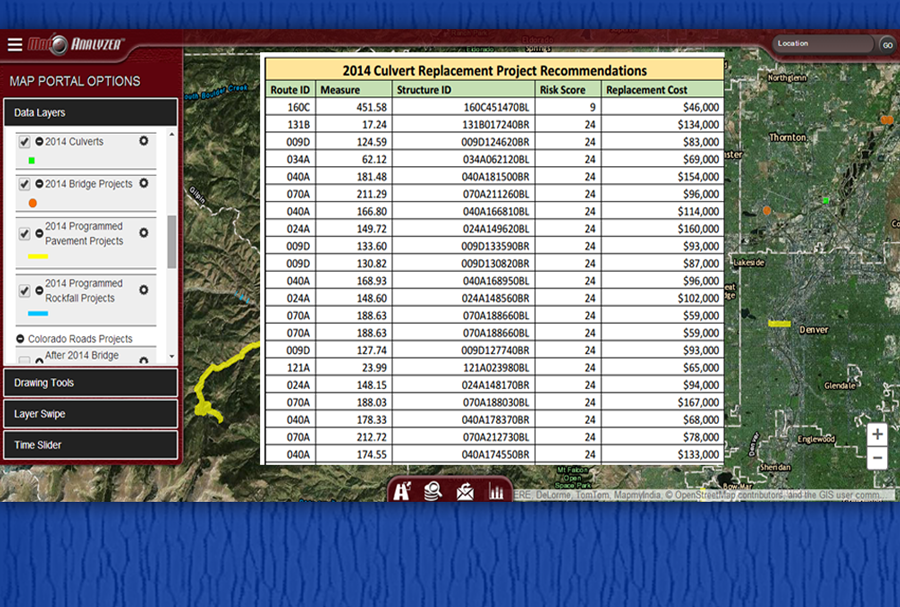
The geospatial portal also allows for viewing, integrating and reporting data associated with each of CDOT's asset categories. The analysis capabilities included in the portal allow for budget and scenario planning. This portion of the pilot demonstrates the ability to view and analyze data in support of effective decision-making based on budget and asset conditions.
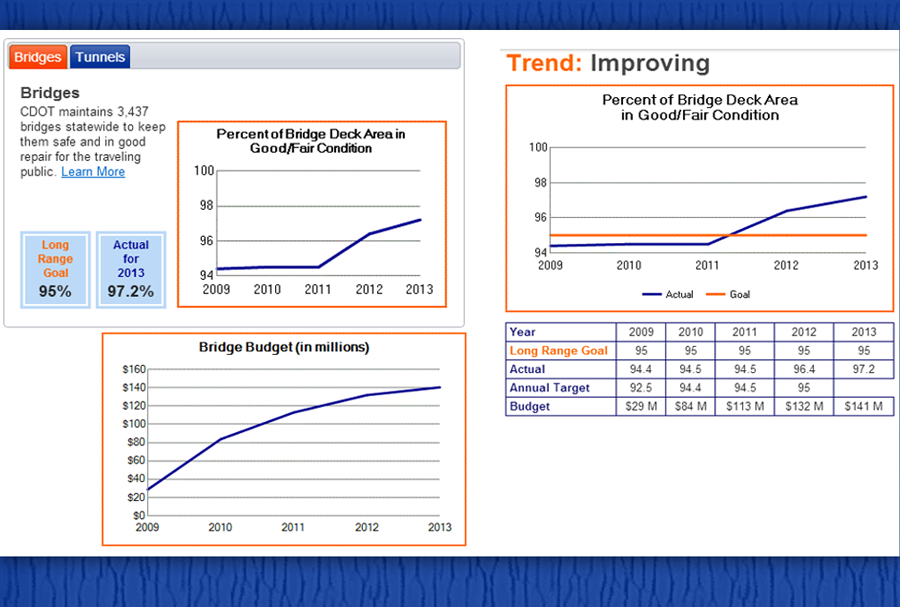
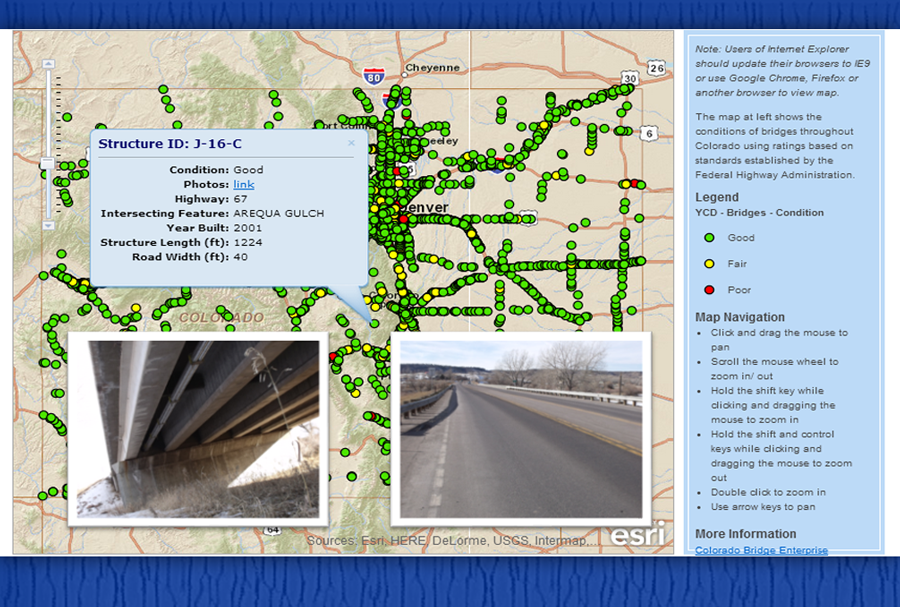
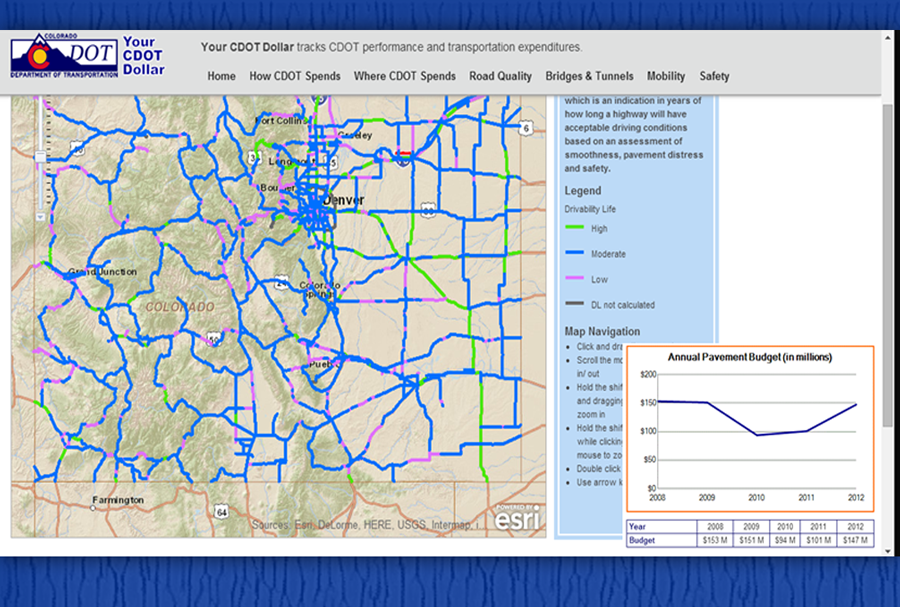
After CDOT's program is developed and funded, project and budget information is summarized and made available through the Your CDOT Dollar (YCD) website. The YCD website provides maps and reports on projects and budgets as well as the performance of the agency's assets based on defined performance goals.
Iowa DOT has an active and mature GIS program, and is well positioned to leverage a variety of data sources for understanding factors contributing to pavement deterioration. In addition, data are available that can be used to fine tune the locations where costly data collection efforts such as non-destructive testing are performed.
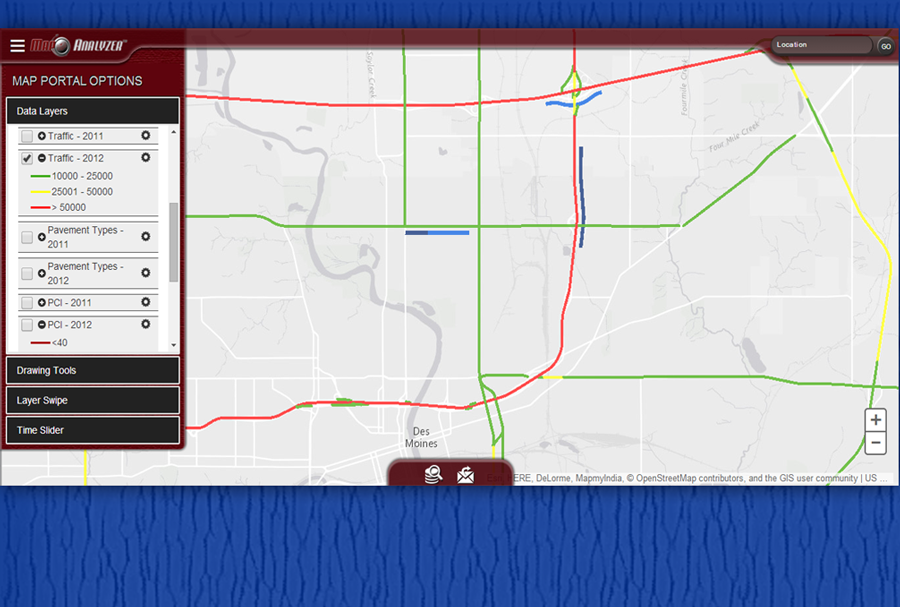
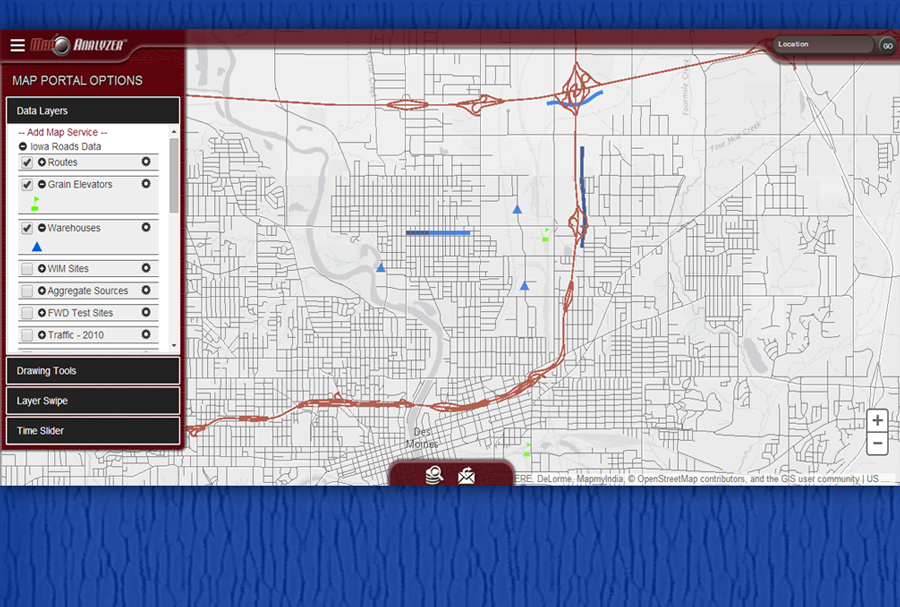
The Department collects and maintains spatially referenced data sets that may be tapped for information on causal factors behind pavement deterioration. Available pavement data include distress, ride (IRI), rutting, friction; and material tests for specific projects. Other available data include traffic, economic contributors, aggregate sources and weather information.
While the network level information is summarized by the pavement management section and made available in the pavement management information system, project level test results are not easily accessible for use following completion of projects. Iowa DOT wants to obtain a higher return on their testing investments.
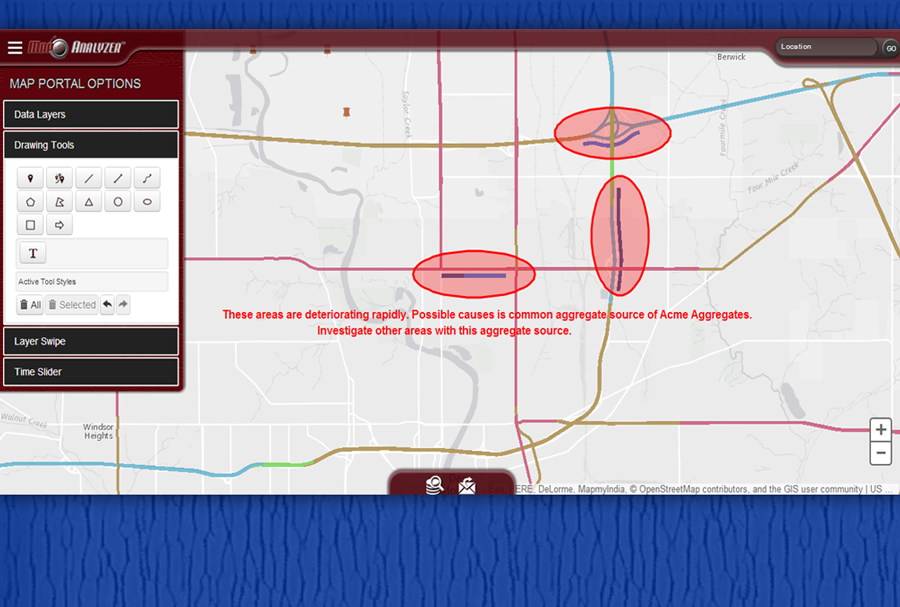
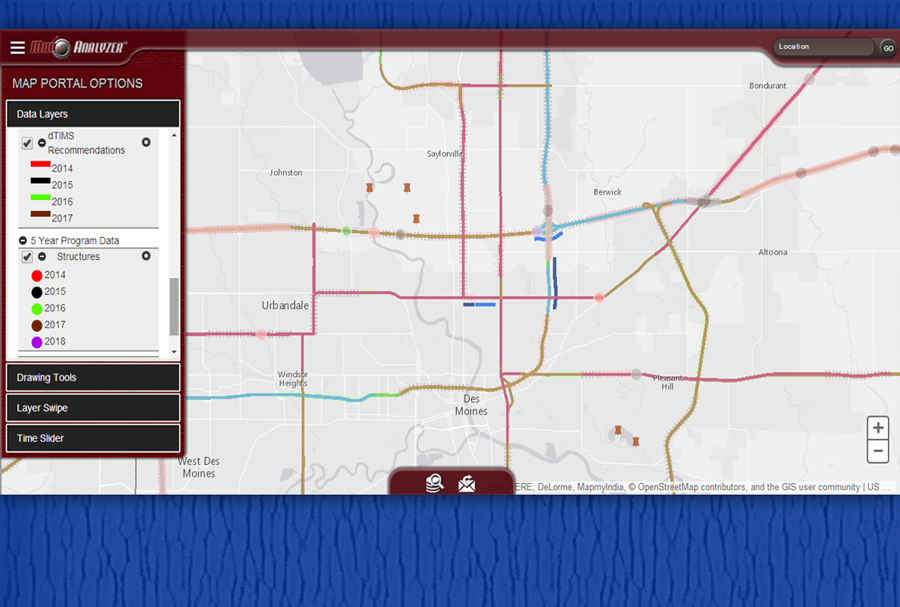
The Iowa DOT pilot illustrates the use of GIS to integrate network and project level pavement data with traffic, economic factors, and aggregate source data to support trend analysis and pattern detection - and communicate results of these analyses in order to identify appropriate actions. It shows how this same body of information can provide value to field office staff as they review potential paving locations and determine appropriate treatments.
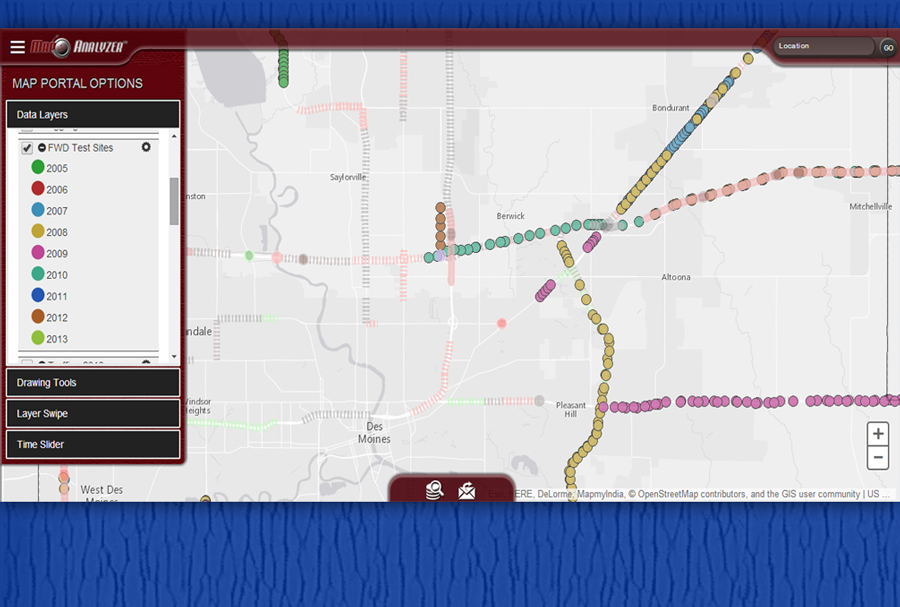
The pilot also illustrates how the agency might utilize Falling Weight Deflectometer (FWD) test results on an ongoing basis to obtain a higher return on investment (ROI) for dollars being spent on these efforts.
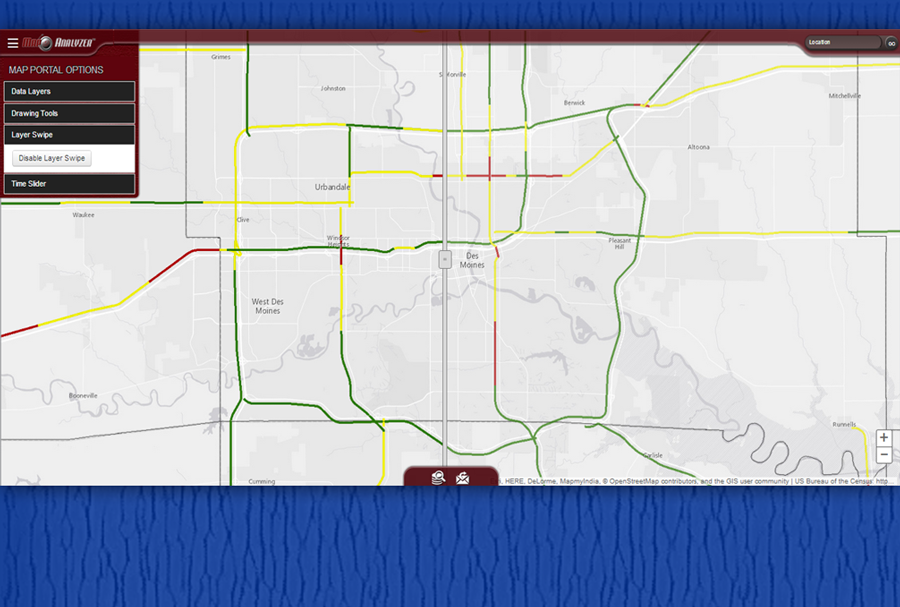
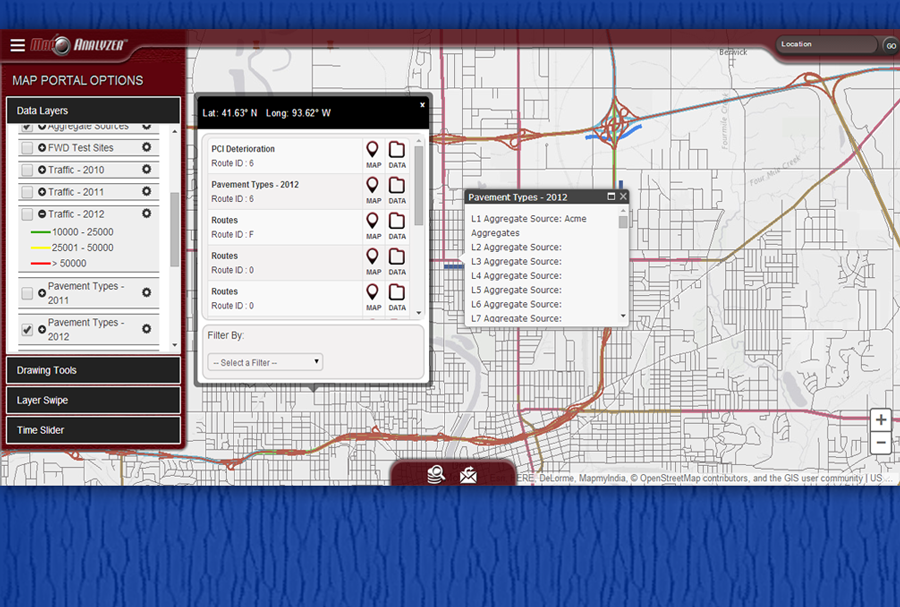
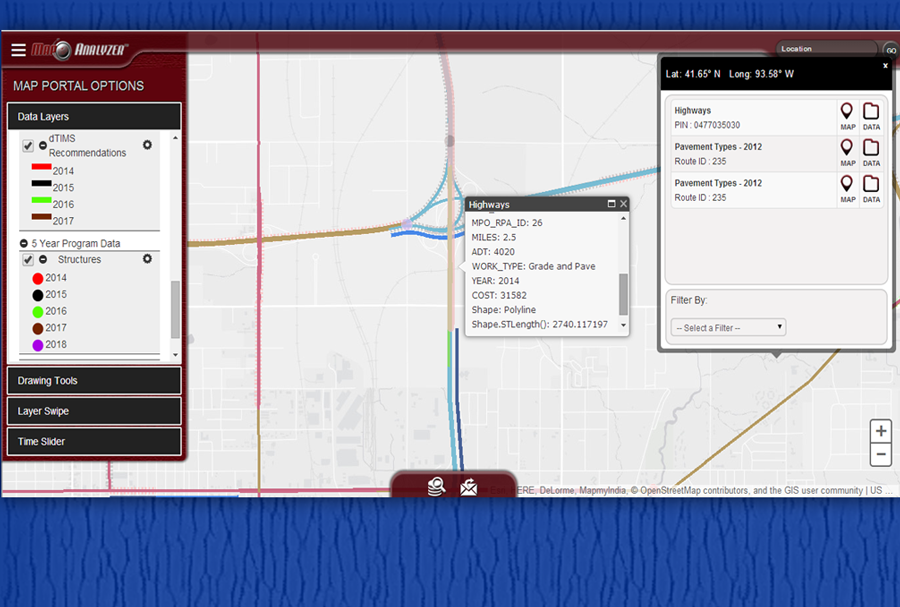
Iowa DOT uses a geospatial portal to integrate information from its different transportation asset management systems. This portion of the pilot demonstration illustrates how to use the power of GIS to overlay information to determine areas of concern or interest.
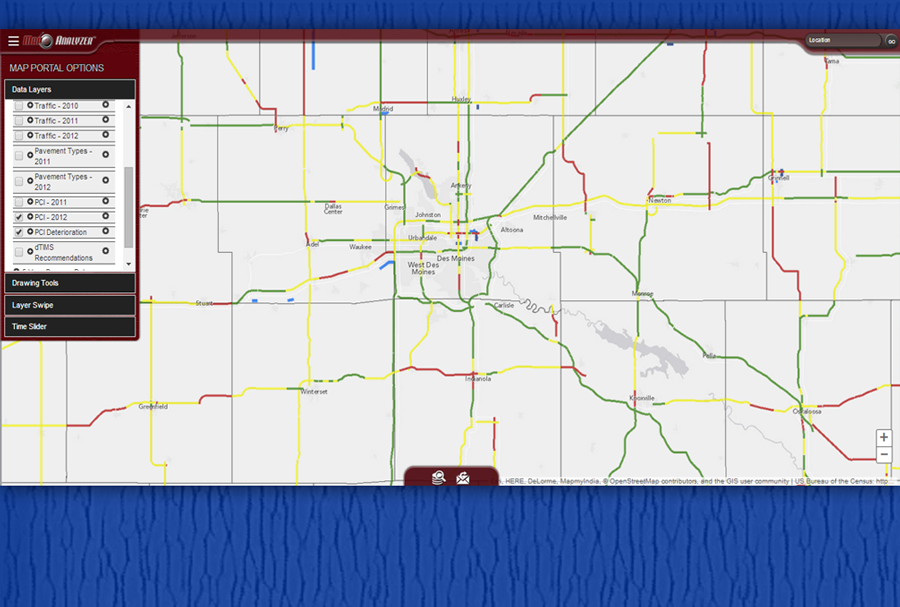
After finding problem locations, geospatial tools can be used to assist with developing recommendations for addressing the identified concerns. This portion of the pilot demonstrates the ability to use GIS to analyze different possible scenarios by integrating program information and deterioration model results to assist in determining if we are targeting the right areas for improvement.
Further analysis can also be conducted to determine if testing that has been done offers a good return on the agency's investment. GIS allows for combining data that is only connected via its location resulting in a more functionally rich set of analysis tools.